And How It Affects Texas Solar
By Ron Zagarri, TXSES
December 28, 2018
Falling module prices are nothing new for the solar industry, as 2018 has emphatically shown.
On May 31, 2018, the Chinese government abruptly cut a key incentive for domestic solar development, and a whopping 20 GW of demand in China evaporated overnight. The resulting glut of manufacturing capacity drove down prices as module makers scrambled to maintain sales and absorb costs at the sacrifice of profitability.
When it comes to solar modules, China is the dragon in the room. As the world’s largest module maker and biggest solar consumer, what happens in China does not stay in China. Bloomberg New Energy Finance (BNEF) observed, these price cuts would spread globally. “Oversupply is universal,” noted one analyst.
China’s solar stratagems have never been easy to fathom. Since we cannot peek inside the Chinese playbook – if there is a playbook – it is difficult to determine a natural end goal of their policies. To underscore this reality, in an apparent turnabout in November, pv magazine reported that policy makers are considering increasing their solar installation targets in order to prop up their domestic manufacturers and repair some of the damage.
Forecasting Module Prices
Even in the most stable of circumstances, forecasting global module prices is a formidable game. As Nobel physicist Niels Bohr said, “Prediction is difficult, especially about the future.” In light of a policy perturbation of this magnitude, any forecast of year-end module prices made prior to May 31 became obsolete. Revised projections were unlikely to be accurate, considering the carnage about to occur in the entire solar value chain. Nonetheless, industry analysts never stop trying.
Shortly after the Chinese announcement, BNEF made a courageous prediction that prices would decline 34 percent by year end. This would price modules at about 24 cents per watt in China, a figure never before seen. If this forecast were accurate, it would reshape the competitive dynamic of the entire industry.
After reading this projection in June, I decided to track and record weekly module prices to determine whether the BNEF analysts were seeing the market clearly. Three organizations publish this information, and these data gathering services are instrumental in creating a transparent, liquid market. Figures used here are from PVinsights.com. (See also energytrend.com and en.pvinfolink.com.)
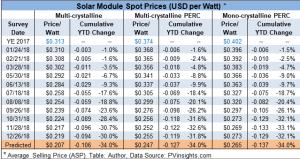
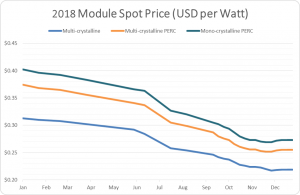
The table on the left reflects how prices actually behaved through the year, registering persistent monthly declines. The collapse accelerated in July and culminated in prices firming in December.
The table displays global prices for the three major crystalline silicon module types: multi-crystalline, multi-crystalline PERC, and mono-crystalline PERC. “PERC” stands for passivated emitter rear contact, an increasingly popular and important innovation that improves module efficiency and drives down system costs.
Today, seven months later, the June Bloomberg forecast turned out to be remarkably accurate. For each product, year-end 2018 prices ended up nearly matching the predicted value. For the two PERC products, the difference is negligible. Hats off to the BNEF analysts!
Module Prices Matter
As solar module prices decline, they make up a smaller proportion of the total installed system cost. Some analysts make the specious argument that modules are therefore less relevant than price swings in other system components, like capital, permitting, and inverters.
This view is analytical myopia and a failure to understand the real and perceptional importance of the module. The solar industry uses module prices as a proxy for solar prices in general. Just as the Dow Jones Industrial Average serves as a proxy for the stock market as a whole, companies and governments track spot price trends to decide whether to invest in projects that will not materialize for several quarters. Module prices are a harbinger of things to come.
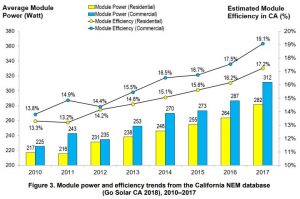
With the welcome new emphasis on improving module efficiency in recent years, the module also provides indirect financial value. In their November report, U.S. Solar Photovoltaic System Cost Benchmark: Q1 2018, the National Renewable Energy Laboratory (NREL) notes that efficiency is racing upward, with commercial projects in California seeing a 9.1 percent efficiency increase, and the average residential efficiency climbing 6 percent.
As module efficiency rises, a system of a given size requires fewer modules, thus reducing other hardware costs. This trend also lowers soft costs from direct labor and related installation overhead.
US Module Prices
Do not expect to buy a mono-crystalline PERC module for 27 cents a watt (the current spot price) anytime soon. Spot prices quoted here pertain to the market price at the factory gate. Whether earmarked for a large solar farm or a small residence, additional costs for transportation, insurance, taxes, and distribution significantly increase the price to the end user.
The topsy-turvy world of the administration’s trade policy introduces an additional wrinkle. Each week begets new and/or rumored resolutions with a variety of trading partners, yet the fact remains that imported silicon modules incurred a 30 percent tariff beginning in January of this year.
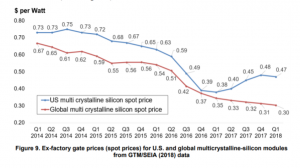
The US price began to diverge from the spot price in early 2017 as tariff talk began in earnest. The premium on US multi-crystalline modules widened from only 2 cents in late 2016 to a crushing 17 cents by early 2018 as the long-feared Section 201 tariff became reality. (See spot price chart at right).
However, with global module costs down and the cost of capital for solar projects falling, this big tailwind mitigates some of the volatility. Even under the tariff burden, modules are now trading below pre-tariff levels in the United States. Solar developers are making aggressive bets on the cost curve continuing to fall, and so far, that has played out. A solar asset that appeared marginal in the first quarter of 2018 may look attractive a year later.
In mid-October, BNEF noted US modules were seeing aggressive price reductions and predicted mono-crystalline PERC prices would fall 20 percent to 37 cents per watt by year end. This forecasted price is DDP (delivered duty paid) and includes tariffs, insurance, and transportation fees. Therefore, it is not directly comparable to spot prices. But in spite of the market chaos this year, that 37-cent price compares favorably to the 47-cent DDP price at the start of 2018. And as tariffs wind down and more domestic module production comes online in 2019, the US module premium should narrow.
The one-two punch of the tariffs in January and the subsidy rollback in May produced unprecedented challenges for the industry, with only modest solar deployment growth, if any, expected in the United States this year. However, solar veterans are adept at riding the solar coaster and focusing on a brighter future.
We are approaching an exciting boom in solar energy deployment that lower module prices help enable. For a preview of that promising future and to see what’s coming in 2019 and 2020, read about the impressive growth in the US solar project pipeline (here) and record-breaking corporate solar procurement (here).