
By Mohammad Alkhatib
Solar Energy: A Bright Future Ahead
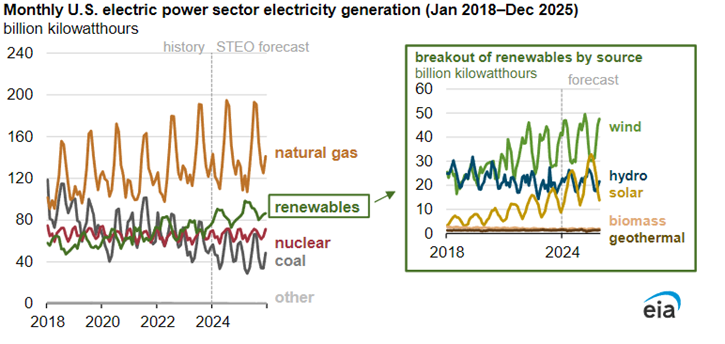
You’re probably aware that renewable energy is the future, but did you know that solar energy is set to lead the charge in the next few years? According to the latest Short-Term Energy Outlook from the U.S. Energy Information Administration (EIA), solar power generation in the U.S. is projected to skyrocket by 75% from 163 billion kilowatt-hours (kWh) in 2023 to an impressive 286 billion kWh by 2025. This explosive growth is driven by numerous new solar projects coming online.
In contrast, wind power is expected to grow more modestly by 11%, from 430 billion kWh in 2023 to 476 billion kWh in 2025. It’s a significant jump but pales in comparison to the solar sector’s growth.
The U.S. electric power sector generated 4,017 billion kWh of electricity in 2023, with renewable sources accounting for 22% or 874 billion kWh, according to research and analytics firm Ohm Analytics. This figure includes wind, solar, hydro, biomass, and geothermal energy. Interestingly, renewable power generation surpassed nuclear generation for the first time in 2021 and coal generation in 2022, highlighting the rapid shift towards cleaner energy.
However, not all news is rosy for other energy sources. Coal power generation is forecasted to decline by 18%, from 665 billion kWh in 2023 to 548 billion kWh in 2025. On the other hand, natural gas will remain the largest source of U.S. electricity generation, maintaining about 1,700 billion kWh annually. Nuclear power generation will stay relatively flat, with a slight increase from 776 billion kWh in 2023 to 797 billion kWh in 2025.
Current Market Analysis
Trends in the Solar Energy Market
Over the past few years, interest rates have significantly influenced the solar market. The market benefited from lower interest rates in 2021-2022, but faced a slowdown in 2023-2024 due to rising rates. Despite these challenges, demand trends have stabilized and shown signs of improvement in 2024, and fundamentals support a positive long-term outlook for distributed generation (DG) solar.
Regional Leaders
Permit trends in some East Coast markets including Massachusetts and Washington, D.C. have been more positive than the rest of the U.S. due to higher energy costs and incentives.
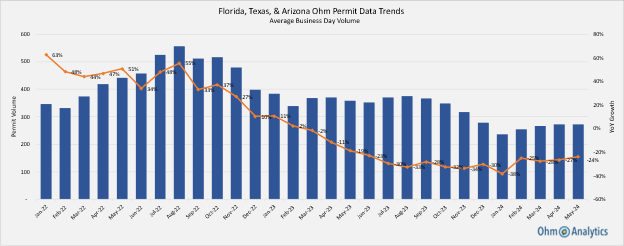
Key Sun Belt markets Texas, Florida, and Arizona YoY (year-over-year) permit issuance improved from a low of -38% YoY in January to -24% YoY in May. Observance of the typical seasonal ramp from January through late summer is a key indicator that the residential solar market is on a path to recovery, transitioning away from an adjustment year in 2024, and setting the foundation for long term growth in 2025 and beyond. A potential risk to sustained recovery in 2024, is a flattening trend through peak summer months, highlighting the importance of the continued monitoring of leading indicators that allow for the tracking of real time market trends.
In the long term, emerging regions on the East Coast and Midwest, such as Pennsylvania, Illinois, and Ohio, show significant growth potential due to reasonable payback periods, rising electricity prices, and supportive incentives.
Forecast for 2025
Predicted Growth
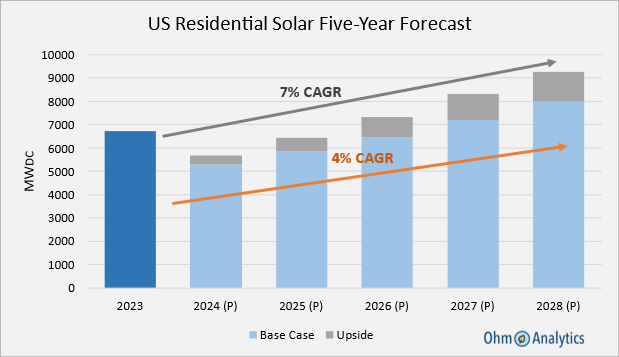
The forecast for 2025 is underpinned by rising residential electricity rates, which increased by 5% year-over-year as of March 2024, and by 30% over the past five years. Utility investments to address load growth and grid safety further support this trend. Installer financing product diversification and federal incentives are expected to drive growth, with 2025 likely rebounding from the low points of early 2024. Long-term projections anticipate a 4% compound annual growth rate (CAGR), driven by federal incentives like the Investment Tax Credit (ITC) and various state-specific rebates and grants, which make solar installations more financially attractive.
Rationale
Key drivers include rising utility rates, new rate cases, and increasing utility investments. Federal incentives such as the domestic content bonus and other ITC adders also play a crucial role. Additionally, consumer interest in sustainability and energy independence, coupled with increasing electricity rates and time-of-use pricing models, enhance the economic benefits of solar adoption. Technological advancements in solar panel efficiency and energy storage, along with innovative financing models, are expected to lower costs and improve the return on investment for solar systems.
Comparative Analysis
Compared to other analysts, the optimistic outlook for 2025 aligns with broader industry expectations. The EIA also forecasts significant growth in solar power generation, further validating the positive long-term prospects for the solar market. The upside scenario envisions a 6% CAGR, with interest rate reductions driving a faster recovery in Southern Belt states like Texas and Florida. The development of smart grids and virtual power plants (VPPs) will further enhance the appeal of solar installations by efficiently managing distributed energy resources and providing additional revenue streams for solar and storage system owners.
A Closer Look at Texas Solar Energy Market Predictions
Texas, a key player in the U.S. solar energy market, has experienced some notable fluctuations. In the first quarter of 2024, Texas saw an increase of 71 MW in residential solar capacity. However, this represents a 52% year-over-year decline. Several factors contribute to this downturn, including low electricity costs and challenges in the loan market, which have weakened market performance. Additionally, the exit of distressed players has also played a significant role in this decline.
Interestingly, despite these challenges, there are signs of optimism. The adoption of third-party ownership (TPO) has stabilized after rising in the second half of 2023, maintaining a market share of around 16% in the first quarter of 2024. More encouragingly, installers in Texas have reported sequential growth improvements throughout Q1. Leading indicator trends have shown a significant rebound, improving from a low of -52% year-over-year in December to -16% year-over-year in April.
One of the key strategies contributing to this positive trend is the ability of installers to offer lower costs, thanks to decreasing equipment prices. Additionally, utilizing a broader range of financing options has helped attract more customers. Despite the initial negative start to the year, these factors suggest potential for recovery.
Given the challenging start to 2024, we have slightly adjusted our forecast for the Texas residential solar market to a -29% year-over-year decline. However, the improving trends and strategic adjustments by installers provide a basis for cautious optimism as the year progresses.
Conclusion
The solar energy market is poised for significant growth in the coming years, driven by supportive policies, rising utility rates, and technological advancements. By leveraging detailed insights from Ohm Analytics, stakeholders can make informed decisions to navigate this dynamic market landscape. The growth of the solar energy market holds immense potential for the future of global energy, and stakeholders should consider these predictions in their strategic planning and decision-making processes.
References
- U.S. Energy Information Administration. (2024). Short-Term Energy Outlook. Retrieved from EIA.
- Ohm Analytics. (2024). Solar Data Platform. Retrieved from Ohm Analytics.
Ohm Analytics Methodology
Ohm Analytics is a leading research and analytics firm specializing in the energy transition, providing a comprehensive data platform that tracks market volume, growth, pricing, and equipment trends across over 50 major metro areas in the U.S. Utilized by utility clean energy teams, solar financing companies, equipment manufacturers, technology firms, and service companies for strategic planning and business development, Ohm Analytics aggregates data from thousands of sources, including public records and proprietary partnerships, to build a robust database of solar projects. Their platform incorporates data at multiple points within the sales and installation pipeline, including contractors lead volume, sales activity, permitting, interconnection data, and industry commentary to offer a real-time view of the market. The analytical techniques and models employed by Ohm Analytics ensure high accuracy and reliability, supported by rigorous quality assurance and external channel checks.